
CostGraph Operator Installation Guide

Prerequisites

1

Set up Prometheus

If you already have Prometheus running in your cluster, you can skip these installation steps and proceed directly to the next step.In your Helm values.yaml, set the prometheus_endpoint to your existing Prometheus URL.For example, if you’re using the kube-prometheus-stack, the endpoint is typically:
prometheus_endpoint: http://kube-prometheus-stack-prometheus.kube-prometheus-stack.svc:9090
Add the Prometheus chart repository:
helm repo add prometheus-community https://prometheus-community.github.io/helm-charts
Install Prometheus to begin collecting metrics:
helm install prometheus prometheus-community/prometheus --namespace prometheus-system --create-namespace
kubectl wait --for=condition=available --timeout=10m -n prometheus-system deploy/prometheus-server
2

Obtain API Key

Create an account on costgraph.baselinehq.cloud and obtain an API key.
3

Set up Billing Plan

Setting up a planYou must have a plan setup for your organization to use the operator. Not doing so will cause the operator to fail on startup.
Once you have your API key, set up a billing plan to enable the API key.
4

Add CostGraph Helm Repository

Add the CostGraph charts repository:
helm repo add costgraph https://baselinehq.github.io/costgraph-charts/
helm repo update
5

Configure CostGraph

Create a configuration file (values.yaml) with your specific settings:
domain: <your-company-subdomain>
costgraph:
  config:
    costgraph_instance_name: <instance-name>
    prometheus_endpoint: # e.g http://prometheus-server.prometheus-system.svc.cluster.local
    api_key: <your-api-key>
6

Deploy CostGraph

Deploy CostGraph using your configuration file:
helm install costgraph costgraph/costgraph -f values.yaml --namespace costgraph-system --create-namespace
7

Verify Installation

Wait for all pods to be ready and verify the installation:
kubectl get pods -n costgraph
All pods should show a Running status before proceeding to access the dashboard.

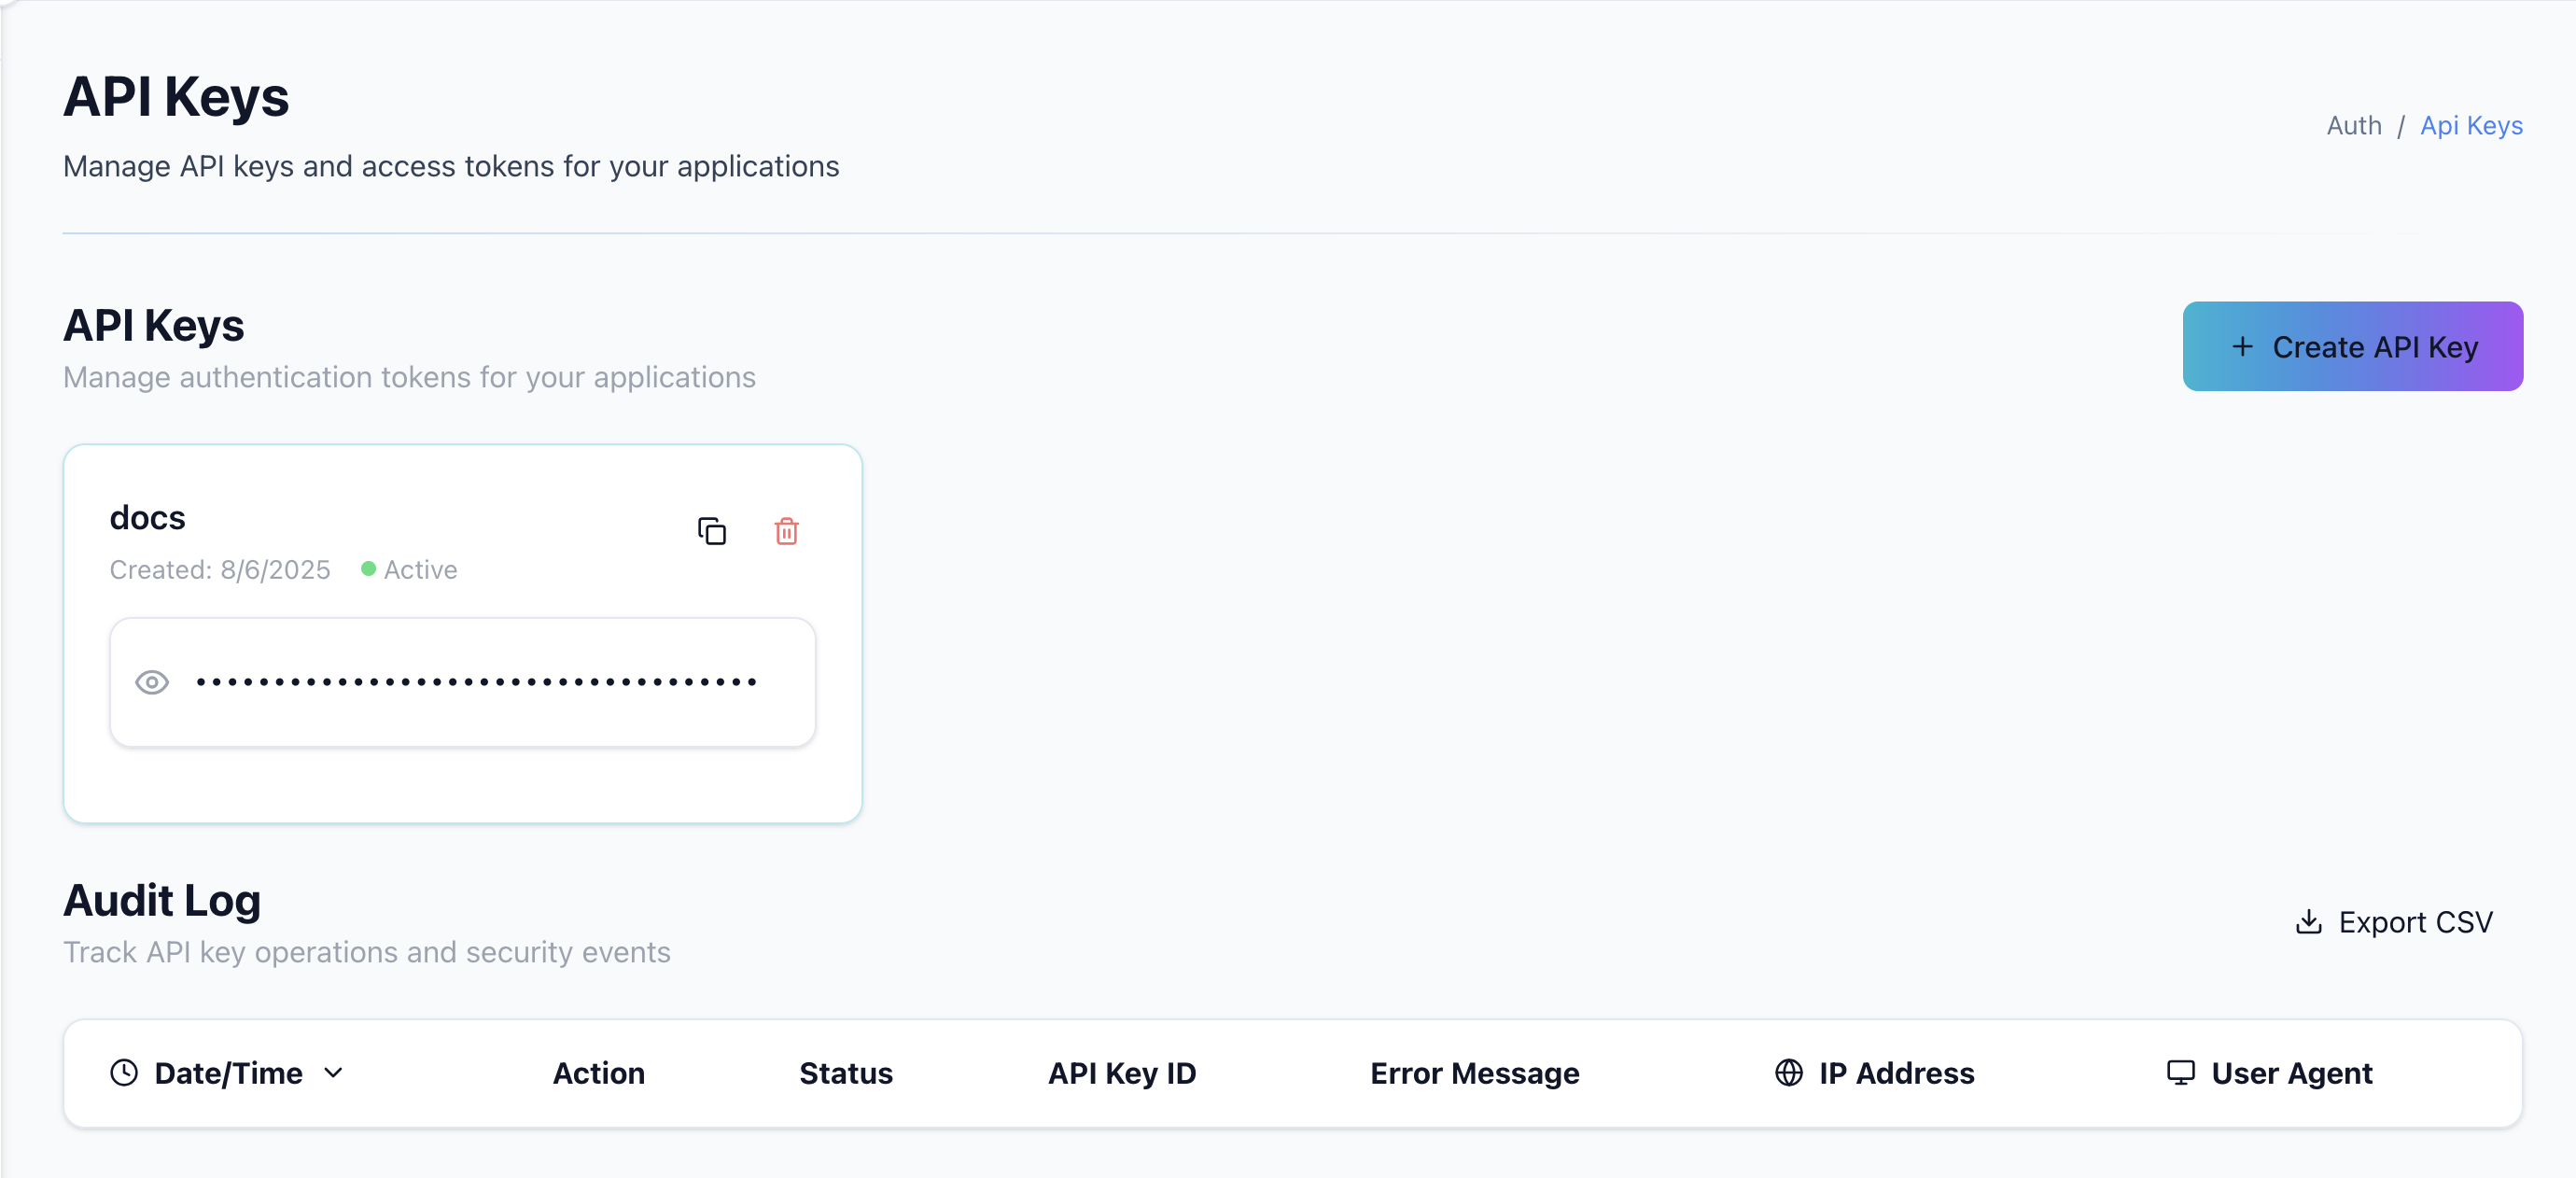
Accessing the Dashboard

You can access your cluster metrics in the cluster section of the CostGraph dashboard. Dashboard

Advanced Configuration

For the full list of values supported by the CostGraph Operator Helm chart (all values.yaml options), see the Kubernetes configuration reference.

Alternative Visualization Methods

CostGraph supports other visualization methods such as Grafana and Superset. For more instructions on setting up and accessing these tools, see our Alternative Visualization Methods guide.