Installation
Kubernetes operator
Prerequisites
Before you begin, you will need to have the following:Prometheus
If you do not have prometheus-server installed on your cluster, you can use the installation guide below:- Add the chart to deploy prometheus on the cluster.
Existing Prometheus installations
Existing Prometheus installations
If you already have Prometheus running in your cluster, you can skip these installation steps and proceed directly to the Configuration section.In your Helm
values.yaml, set the prometheus_endpoint to your existing Prometheus URL.For example, if you’re using the kube-prometheus-stack, the endpoint is typically:- Install the operator to begin collecting metrics for workloads on the cluster.
Obtain an API Key
To run the CostGraph operator, you will need to create an account on costgraph.baselinehq.cloud to obtain an API key.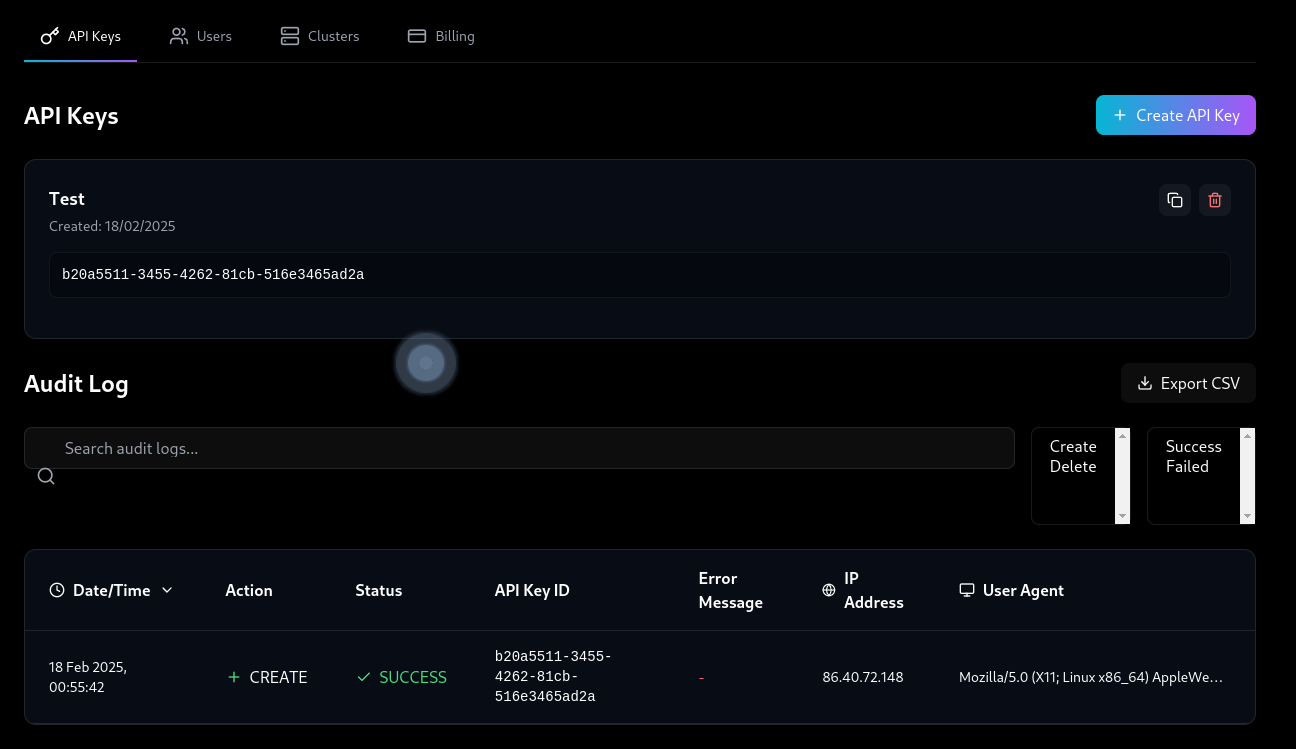
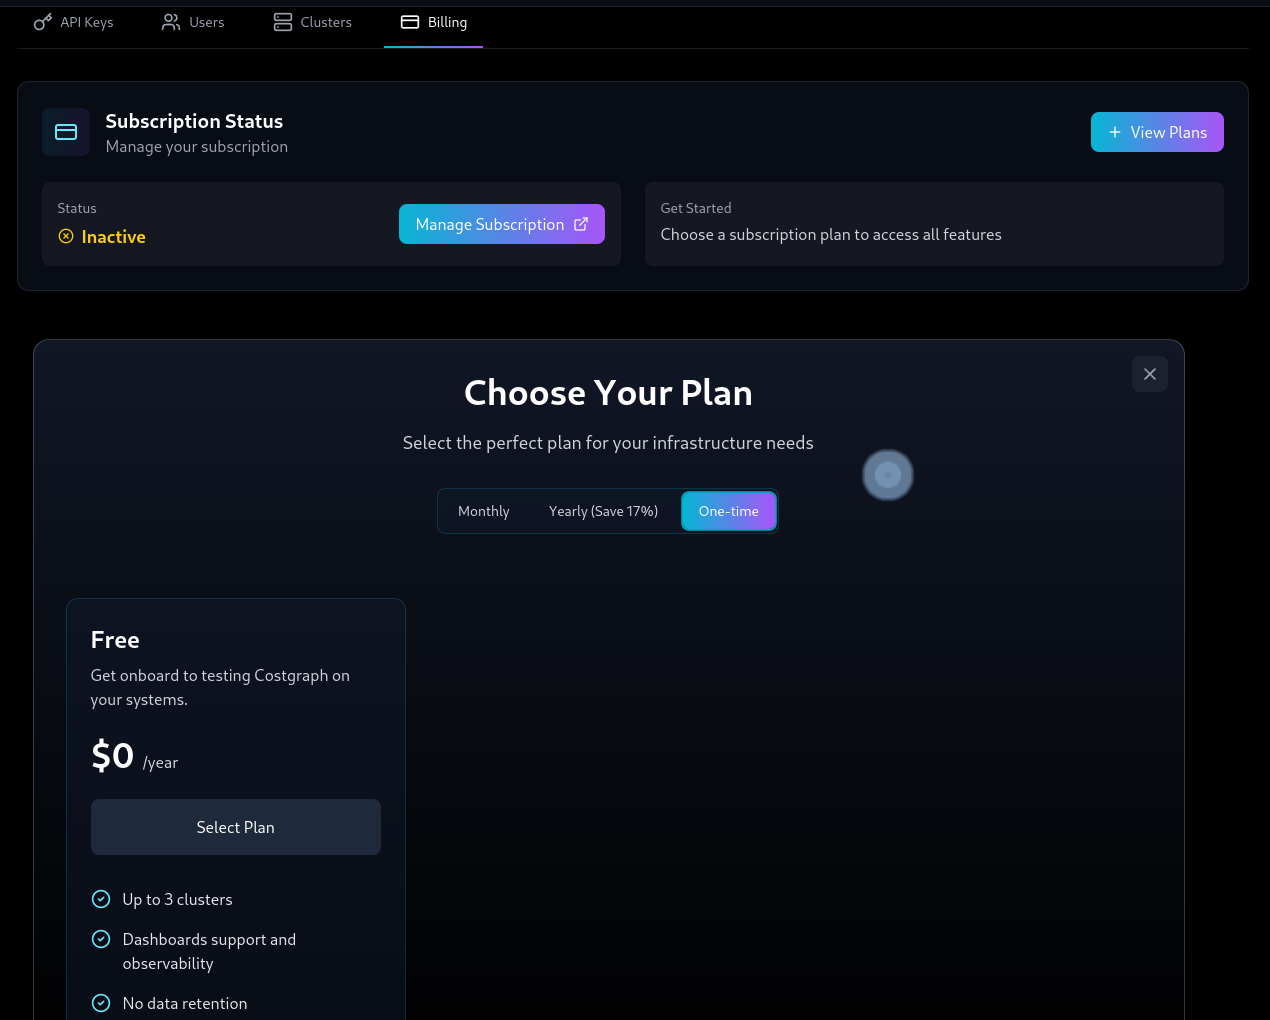
Setup a plan
Once you obtain an API key, setup a plan to allow the API key to have billing enabled.Setting up a planYou must have a plan setup for your organization to use the operator. Not doing so will cause the operator to fail on startup.
Free Plan Available For Developers
One-Time tab to begin using CostGraph without any payment.
Helm configuration
In deploying the CostGraph operator, the charts are available in the GitHub repository costgraph-charts Run the helm command below to import the charts into the repository to begin deploying the operator.Configuration
CostGraph
Create a configuration file with the helm updates that are required in deploying the packageUsing Multiple Cost Centers
costgraph_instance_master_domains configuration.
You can append multiple clusters to the configuration, this will be the costgraph_instance_name of the instance you want to view costs from.
Expected Utilisation Percentages
If you want to configure expected utilisation percentages for recommendations on the CostGraph instance, you can change it using the following configuration:Superset
To configure the superset credentials, update the configuration for the superset setting.Postgres
Postgres Configuration
true and update the size for the PVC.
This will create a StatefulSet for the database instance and does not directly configure a PVC for the database.
Deployment
Finally deploy the configuration with the updated settings for your CostGraph instancePost Deployment
In the tabs below, you will find features available to you after the helm deployment is complete and resources are provisioned successfully.Superset Credentials
admin and adminOnce the deployment is complete, you can access the CostGraph dashboard on the domain costgraph.$domain and login with the credentials provided in the configuration file.Accessing the dashboard
Ensure that the domain is accessible from the network you are connecting from. If you are using a local cluster, you can use thekubectl port-forward command to access the dashboard.The quickest way to access the dashboard is to use port forwarding. This will forward the port You can then access the dashboard on
8088 on your local machine to the port 80 on the CostGraph service.localhost:8088 in your browser.